October 2024
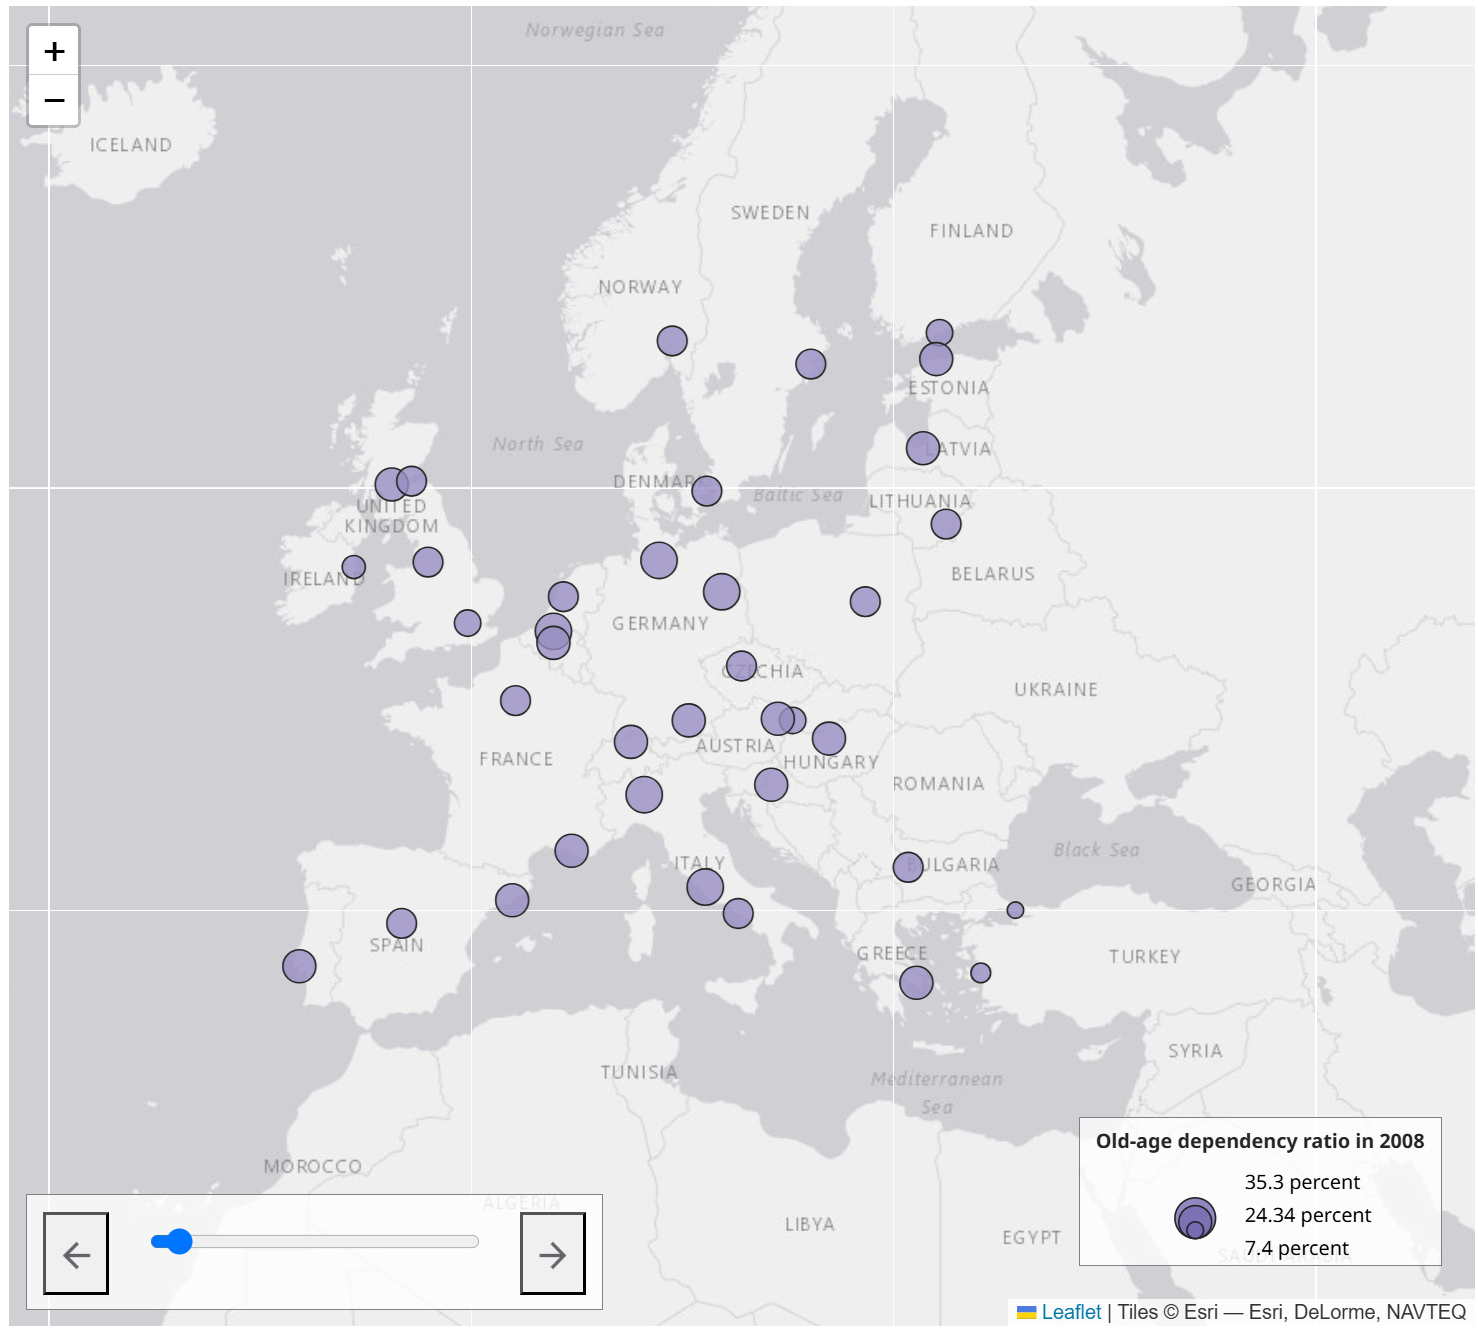
This interactive web map, powered by Leaflet and OECD data, visualizes evolving old-age dependency trends across major European cities. Hosted on GitHub, the app offers customizable color schemes for a dynamic exploration of demographic shifts. I developed the app as part of my Interactive Cartography and Geovizualization course at the University of Wisconsin–Madison.